<cfscript>
// ChartDirector for ColdFusion API Access Point
cd = CreateObject("java", "ChartDirector.CFChart");
// A utility to allow us to create arrays with data in one line of code
function Array() {
var result = ArrayNew(1);
var i = 0;
for (i = 1; i LTE ArrayLen(arguments); i = i + 1)
result[i] = arguments[i];
return result;
}
//===================================================================
// For demo purpose, use random numbers as data for the chart
//===================================================================
// Use a random table to create the data. The random table contains 4 cols x 31 rows,
// using 9 as seed.
rantable = cd.RanTable(9, 4, 31);
// Set the 1st col to be the series 1, 2, 3, ....
rantable.setCol(0, 1, 1, 1);
// Set the 2nd, 3rd and 4th col to be random number starting from 40, 50 and 60. The
// change between rows is set to -5 to 5. The minimum value of any cell is 0.
rantable.setCol(1, 40, -5, 5, 0);
rantable.setCol(2, 50, -5, 5, 0);
rantable.setCol(3, 60, -5, 5, 0);
// Use the 1st col as the axis label
labels = rantable.getCol(0);
// Use the 2nd, 3rd and 4th columns for 3 lines
data0 = rantable.getCol(1);
data1 = rantable.getCol(2);
data2 = rantable.getCol(3);
// Simulate some data points have no data value
for (i = 1; i LT 30; i = i + 7) {
data0[i + 1] = cd.NoValue;
data1[i + 1] = cd.NoValue;
data2[i + 1] = cd.NoValue;
}
//===================================================================
// Now we have the data ready. Actually drawing the chart.
//===================================================================
// Create a XYChart object of size 600 x 220 pixels
c = cd.XYChart(600, 220);
// Set the plot area at (100, 25) and of size 450 x 150 pixels. Enabled both vertical
// and horizontal grids by setting their colors to light grey (0xc0c0c0)
c.setPlotArea(100, 25, 450, 150).setGridColor("0xc0c0c0", "0xc0c0c0");
// Add a legend box (92, 0) (top of plot area) using horizontal layout. Use 8 pts
// Arial font. Disable bounding box (set border to transparent).
c.addLegend(92, 0, False, "", 8).setBackground(cd.Transparent);
// Add a title to the y axis. Draw the title upright (font angle = 0)
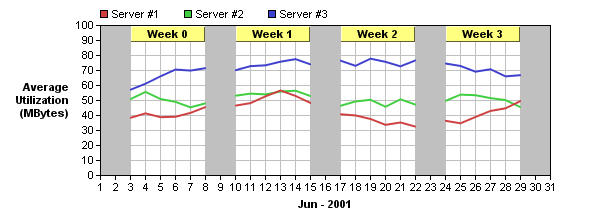
c.yAxis().setTitle("Average<*br*>Utilization<*br*>(MBytes)").setFontAngle(0);
// Use manually scaling of y axis from 0 to 100, with ticks every 10 units
c.yAxis().setLinearScale(0, 100, 10);
// Set the labels on the x axis
c.xAxis().setLabels2(labels);
// Set the title on the x axis
c.xAxis().setTitle("Jun - 2001");
// Add x axis (vertical) zones to indicate Saturdays and Sundays
for (i = 0; i LT 29; i = i + 7) {
c.xAxis().addZone(i, i + 2, "0xc0c0c0");
}
// Add a line layer to the chart
layer = c.addLineLayer();
// Set the default line width to 2 pixels
layer.setLineWidth(2);
// Add the three data sets to the line layer
layer.addDataSet(data0, "0xcf4040", "Server ##1");
layer.addDataSet(data1, "0x40cf40", "Server ##2");
layer.addDataSet(data2, "0x4040cf", "Server ##3");
// Layout the chart to fix the y axis scaling. We can then use getXCoor and getYCoor
// to determine the position of custom objects.
c.layout();
// Add the "week n" custom text boxes at the top of the plot area.
for (i = 0; i LT 4; i = i + 1) {
// Add the "week n" text box using 8 pt Arial font with top center alignment.
textbox = c.addText(layer.getXCoor(i * 7 + 2), 25, "Week " & i, "Arial Bold", 8,
"0x000000", cd.TopCenter);
// Set the box width to cover five days
textbox.setSize(layer.getXCoor(i * 7 + 7) - layer.getXCoor(i * 7 + 2) + 1, 0);
// Set box background to pale yellow 0xffff80, with a 1 pixel 3D border
textbox.setBackground("0xffff80", cd.Transparent, 1);
}
// Output the chart
chart1URL = c.makeSession(GetPageContext(), "chart1");
// Include tool tip for the chart
imageMap1 = c.getHTMLImageMap("", "",
"title='[{dataSetName}] {xLabel} Jun 2001: {value|2} MBytes'");
</cfscript>
<html>
<body style="margin:5px 0px 0px 5px">
<div style="font-size:18pt; font-family:verdana; font-weight:bold">
Discontinuous Lines
</div>
<hr style="border:solid 1px #000080" />
<cfoutput>
<div style="font-size:9pt; font-family:verdana; margin-bottom:1.5em">
<a href='viewsource.cfm?file=#CGI.SCRIPT_NAME#'>View Source Code</a>
</div>
<img src="getchart.cfm?#chart1URL#" usemap="##map1" border="0" />
<map name="map1">#imageMap1#</map>
</cfoutput>
</body>
</html> |