<cfscript>
// ChartDirector for ColdFusion API Access Point
cd = CreateObject("java", "ChartDirector.CFChart");
// A utility to allow us to create arrays with data in one line of code
function Array() {
var result = ArrayNew(1);
var i = 0;
for (i = 1; i LTE ArrayLen(arguments); i = i + 1)
result[i] = arguments[i];
return result;
}
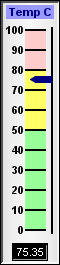
// The value to display on the meter
value = 75.35;
// Create an LinearMeter object of size 60 x 265 pixels, using silver background with
// a 2 pixel black 3D depressed border.
m = cd.LinearMeter(60, 265, cd.silverColor(), 0, -2);
// Set the scale region top-left corner at (25, 30), with size of 20 x 200 pixels.
// The scale labels are located on the left (default - implies vertical meter)
m.setMeter(25, 30, 20, 200);
// Set meter scale from 0 - 100, with a tick every 10 units
m.setScale(0, 100, 10);
// Set 0 - 50 as green (99ff99) zone, 50 - 80 as yellow (ffff66) zone, and 80 - 100
// as red (ffcccc) zone
m.addZone(0, 50, "0x99ff99");
m.addZone(50, 80, "0xffff66");
m.addZone(80, 100, "0xffcccc");
// Add a deep blue (000080) pointer at the specified value
m.addPointer(value, "0x000080");
// Add a text box label at top-center (30, 5) using Arial Bold/8 pts/deep blue
// (000088), with a light blue (9999ff) background
m.addText(30, 5, "Temp C", "Arial Bold", 8, "0x000088", cd.TopCenter).setBackground(
"0x9999ff");
// Add a text box to show the value formatted to 2 decimal places at bottom center
// (30, 260). Use white text on black background with a 1 pixel depressed 3D border.
m.addText(30, 260, m.formatValue(value, "2"), "Arial", 8, "0xffffff", cd.BottomCenter
).setBackground(0, 0, -1);
// Output the chart
chart1URL = m.makeSession(GetPageContext(), "chart1");
</cfscript>
<html>
<body style="margin:5px 0px 0px 5px">
<div style="font-size:18pt; font-family:verdana; font-weight:bold">
Vertical Linear Meter
</div>
<hr style="border:solid 1px #000080" />
<cfoutput>
<div style="font-size:9pt; font-family:verdana; margin-bottom:1.5em">
<a href='viewsource.cfm?file=#CGI.SCRIPT_NAME#'>View Source Code</a>
</div>
<img src="getchart.cfm?#chart1URL#" />
</cfoutput>
</body>
</html> |